USAID Shares a Tool for Assessing Global Water and Sanitation Needs

Summary
The 2022–2027 U.S. Global Water Strategy details how USAID will work with countries to provide millions of people with access to drinking water and sustainable sanitation. But how does the Agency evaluate the degree of need when prioritizing locations for investment, such as high priority countries? One of the components of USAID’s process to identify high priority countries is through a data-driven process to develop a global WASH Needs Index.
This year, for the first time, the results of this WASH Needs Index are publicly available online. An interactive dashboard allows users to access and explore the underlying data and the WASH needs scores for every independent state, as well as other geographic areas where USAID works. Brian Banks, WASH Analytics and Data Advisor with USAID’s Center for Water Security, Sanitation and Hygiene, explains that USAID decided to publish these results because, “We are committed to continuously improving transparency and to increasing the use of data and evidence.”
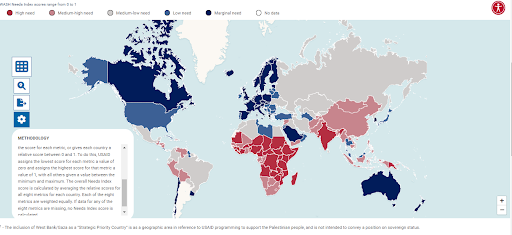
WASH Needs Index map showing high need to marginal need.
What is the WASH Needs Index?
The Senator Paul Simon Water for the World Act of 2014 (“the Act”) requires USAID to focus its investments on countries and geographic areas where the needs and opportunities are greatest and to maximize impact and sustainability. The WASH Needs Index is just one part of that process. (For an overview of the process, see Annex B of the U.S. Global Water Strategy).
“There are a lot of places that have a lot of need but where it’s really difficult to move the needle because of challenging operating environments,” Banks says. “So, the Act proposes that the way we can have the biggest impact with tax dollars is to fund at that intersection of need and opportunity.”
The Act specifies eight indicators for measuring need in a country: three for water, three for sanitation, and two for the health impact of lack of access to water and sanitation, represented by deaths due to diarrhea in children younger than five. The same indicators have been used since 2014, with minor adjustments to align them with the global definitions used for the Sustainable Development Goals.
Calculating the scores
Every year, USAID uses the most recent data available on the eight indicators to generate WASH needs scores. Most of the health impact data are obtained from the World Health Organization (WHO). The water and sanitation data are primarily from the WHO-UNICEF Joint Monitoring Programme.
The index includes indicators of absolute need (the number of people) and relative need (the percentage of the population) to ensure that countries with smaller populations “can still be part of the conversation,” Banks says. “By looking at this question from eight different angles, we start to get a pretty clear picture of where the needs are and that doesn’t give more weight to one piece more than another.”
In Haiti, for example, the number of people without access to basic water is far lower than the number of people without access to basic water in countries with much larger populations, such as Nigeria. But, in Haiti, these numbers represent a greater percentage of the total population without basic access than in Nigeria and, as a result, both countries are ranked in the top 20 in the WASH Needs Index.
Using the data
USAID uses countries’ ranked scores, along with assessments of opportunity for impact and a robust evaluation of programmatic considerations, as an input into annual planning and budgeting recommendations. The information from the WASH Needs Index also enables the Agency to fulfill a requirement to notify the U.S. Congress of any plans to provide Water for the World funding to a country that is not among the 50 with the greatest need.
The image below shows the rankings for each indicator, as well as the overall rank and score, for USAID's top 10 high-priority countries from the 2022 index.

Now it’s your turn
The WASH Needs Index data are available to view as a map or a table. Watch this brief video to learn how to navigate the features.
How will these data inform your work?

About the Author
Kathleen Shears, MS, is a science writer and communications specialist who works with the Research Utilization team at FHI 360 to translate public health research findings into evidence-based policies and practices. Before joining FHI 360, Kathleen served as a communications manager for global projects advancing child survival and infectious disease prevention. She was also a congressional aide specializing in health and education issues and a newspaper reporter. Kathleen has a master’s degree in journalism from the University of North Carolina at Chapel Hill. Video created by the Global Waters Communication and Knowledge Management II (CKM II) team. FHI 360 is a CKM II partner.